Is your program crashing due to a segmentation fault or some other error? Not sure why? Use gdb (GNU debugger) to pointpoint the section of code that’s causing problems. gdb comes installed by default on most linux installations.
In order for gdb to work, the program must be compiled with debugging flags. For example:
nasm -f elf -g -F dwarf spaceinv.asm
First, launch the program within gdb using the following command:
gdb program_name
The debugger will display some informational messages followed by a “(gdb)” prompt. From there, issue the run command to start the program.
(gdb) run
The program will execute normally, but when it crashes gdb will give you information about the signal received from the operating system and insight as to why it failed.
Example output of crash:
Program received signal SIGSEGV, Segmentation fault.
mainloop.getrandom () at spaceinv.asm:897
897 mov [edx], eax
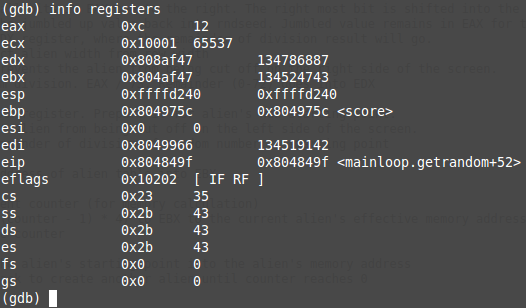
Knowing the state of the registers can be helpful when troubleshooting. To see what values were in the registers when the program crashed, use the info registers command.
(gdb) info registers
After gathering the necessary troubleshooting information, terminate the program with the kill command.
(gdb) kill
Finally, exit the gdb utility with the quit command.
(gdb) quit